In the afternoon winds sweep down the valley making the wires sing. I have lost more that one hat unsecured, blown into the waters of the river.
The rocks are curved, smoothed, at times polished. The upstream northern faces are bowed like backs bent into the wind, or laid flat. Downstream and to the south, several rocks have a steep plane angled face, tending towards vertical, of a more or less uniform blackness.
It is this deep black varnish that makes the drawings so vivid. It is both dark and shiny, whereas the scratched or pounded surface on north facing surfaces is often gray, powdery and pitted. When the sun shines down on the rock and reflects off the patinaed surface towards the viewer, the faintest etchings can be seen grey against the bright reflected light. But under diffuse lighting from the broad sky, the drawings show up white against the dark.
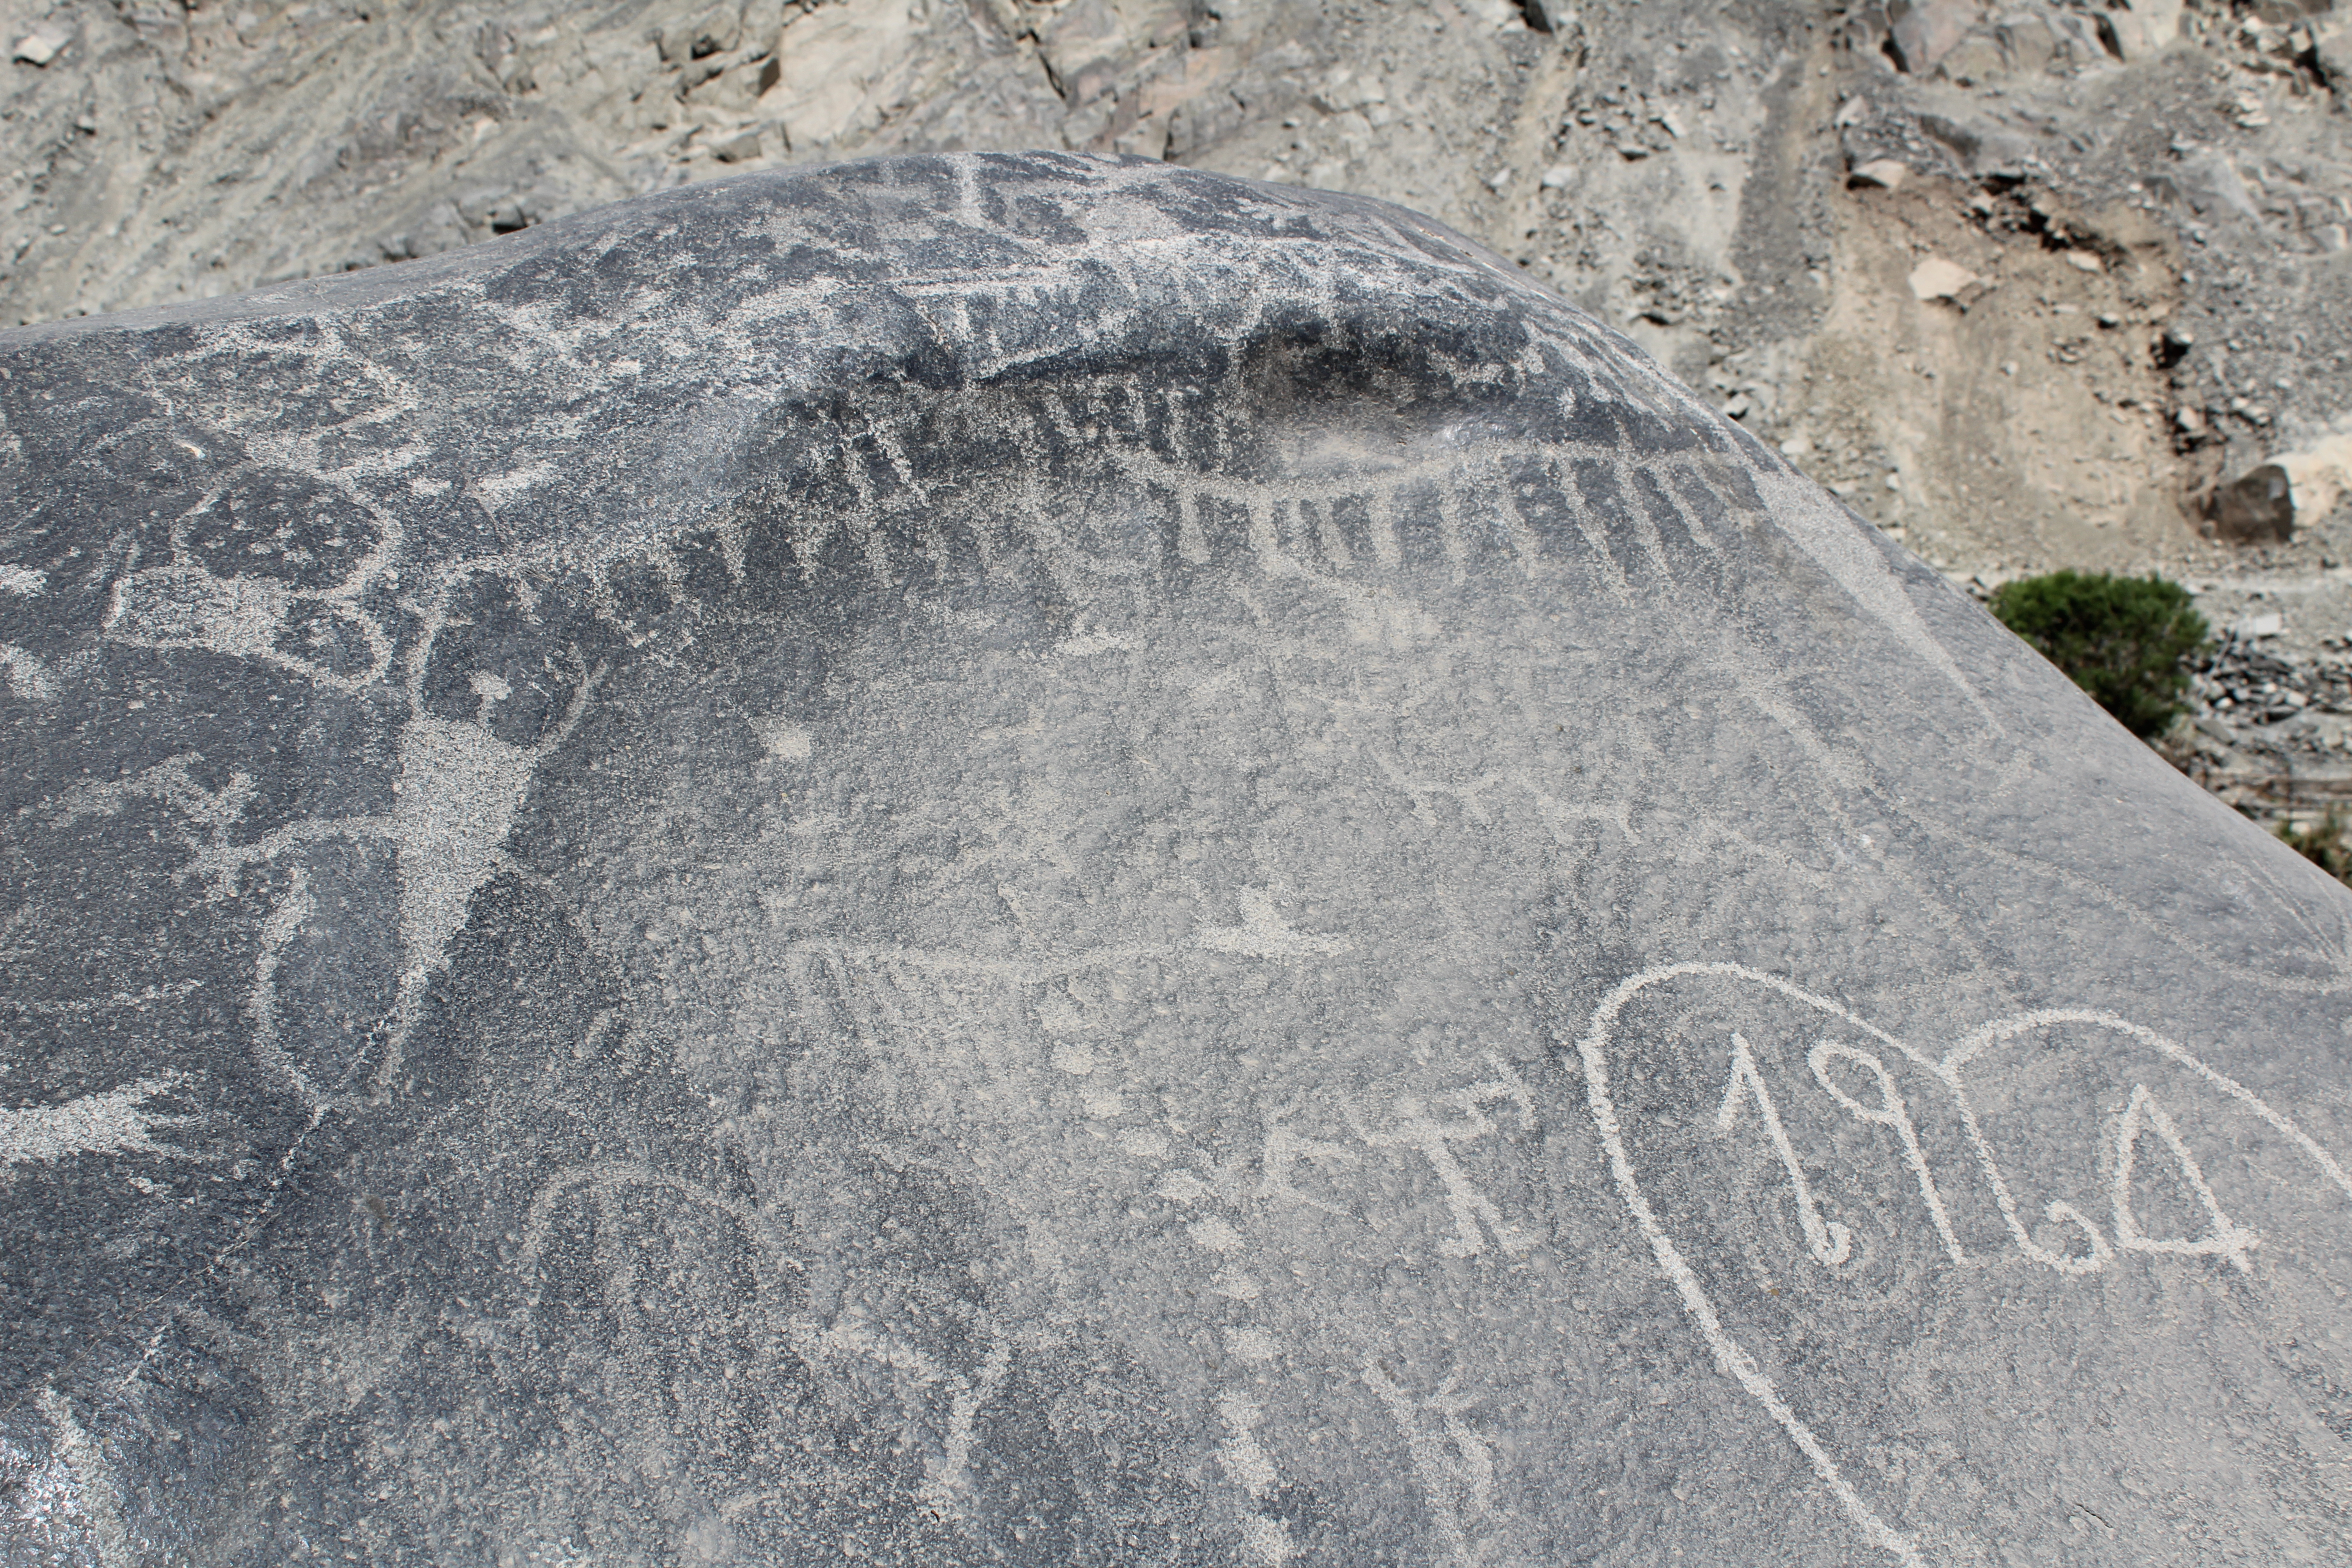
These fresh white markings, according to the evidence on the stones, start to fade with time. The brightest markings are JUAN, JMJR, and the giant heart dated 1964. Also bright, though crudely scratched, is LIZ.
After these we have, on the southern face of the Pariacaca Rock, a line of dots running vertically down, two shawl pins, a geometric crab figure, a condor, a figure holding a staff, and barely visible under the modern giant heart, a spiral. The range of brightness, whiteness, varies from a bright white to a dull grey. With the naked eye, it is easy enough to determine four or five different brightness levels on some rock faces. Other rock faces, particularly those facing skyward or towards the north, upriver, show little visible variation.
We can measure the brightness of the images engraved on the rocks, and see a variation from 215 to 150 on the jpegs. We can see and measure at least six different levels of brightness across Rock 11, implying six different time periods for the drawings.
The measurements show good consistency of brightness across one image or group of images, based on more than one reading – we can look at the line of dots, or the line of ice and snow, and we find consistent results for brightness which give us an average result and also an error range.
This certainly gives us a way of differentiating, and measuring the difference, between drawings. Our hypothesis is that the difference is due to the age of the drawings, based on the obvious brightness of the modern drawing, dated 1964 but possibly after 1980.
It is also supported by the superposition of some images. On Rock 11, it is clear that the tupus are superimposed on the old llama, just as the 1964 is written over a faint spiral. The left hand side of the Southern Face has many such over-drawings.
But whilst we can measure layers, we can`t date them. We can take two dates for 50 and 500 years ago, and do some extrapolation, but its shaky. What would be invaluable would be some cross dating. Some iconography for which we have a alternative date.
Two great rock faces, both facing south, and steeply sloped, some 30 degrees off the vertical, show several distinct layers to the naked eye. The southernmost rock, and perhaps the largest, has even greater potential – 20 square metres of rock face with a largely constant slope, and hundreds of drawings. But the face is steeply sloped with an overhang of four metres to the river level on the East, and a two metre drop to the south. Roped climbers or a drone will be required to photograph the panels at a consistent angle. And whilst the angle in the north south direction varies little, the rock has a series of folds which present different faces to east and west, making it difficult to record with consistent illumination under the sun and sky.
The twelve other rocks have different orientations towards wind and river, different surface shapes, and do not show the same clear variation in brightness. They do however share much imagery with the southern three, and also have overlapping designs which provides further evidence of relative age.
I was struck on that first visit by the possibility of dating the petroglyphs, one of the largely unfulfilled dreams of rock art investigators.
I should be able to produce chronological strata for each rock face, and cross reference them to develop a bigger picture. As above, the spiral is older than the condor, which is older than the crab. The pins are older than the dots, which in turn are older than LIZ.
The variation is even more apparent looking at photographs. The eye in strong sunshine is not very sensitive to brightness levels, and images on screen are easy to adjust.
Using an image analysis package I can quantify the images in many ways: drawing a line or a rectangle across the image I can plot the image intensity, or brightness, by selecting an area I can calculate mean, median, standard deviation and skew. But the camera, in most cases, throws away some information to keep the image to a manageable size. It stores images in a particular format, typical Jpeg, that both compresses and distorts the original light intensity measurement. I want the actual intensity of light reaching the CCD sensor which is recorded unaltered by some cameras as a RAW image.
A jpg image gives a brightness range from 0 to 256. The 1964 heart gives us 220, the Tupus being the next brightest drawing at 200 to 210, with the fainter old llama clocking 160. It is obvious that if a brightness drop from 220 to 200 represents a time difference from 1964 to 1532, the arrival of the Spanish or shortly thereafter, then a linear relationship would put the old llama and similar images at 900 years before the Spanish, and 1350 years before the present.
The relationship between the intensity of the light reflected from the white image and the wearing process to which the rock surface is subject, may be something we could hypothesise about. But that is several steps removed from the pixel intensity of a jpg image. Firstly, the jpg is a severely compressed version of an original digital camera image. The latter divides the brightness into 12 or 14 bits, 4000 or 16,000 levels (in actuality, an original image viewed with Fiji measures the pixel intensity up to 64,000). By selecting the appropriate aperture and exposure time, the photographer (or the camera’s automatic exposure) seeks to position the average brightness in the centre of this range and the lightest and darkest areas at the two extremes. This range, on a RAW image, does represent the brightness of an image on the stone, in the sense of the intensity or energy of the reflected light per unit area, in a linear way. A 10,000 pixel value on a RAW image should be receiving twice as much light energy as a 5,000 pixel value.
The jpg converts this zero to 32,000 scale into 8 bits or a 0-256 scale, compressing it by a factor of 128. If this were a linear compression it would still represent image intensity, which we could in turn relate to reflectance. But the jpg compression attempts to compensate for the loss of information by giving greater memory space to the brighter areas, which the human eye differentiates more clearly.
Old photographic film did not respond linearly to light. The incident light created a dark area on the negative, and the negative could respond and record light from a scene across a dynamic range of one to ten thousand – from one burning match, for example, ten metres from the lens, to ten thousand matches burning together. Less than one match was too low to affect the light sensitive chemicals on the film, and more than ten thousand would overload the chemistry, and give a complete black out on the negative, a white-out on the print.
Photographers and film makers talk of a dynamic range of so many stops, each f-stop representing a doubling of the aperture area. The latest film is sensitive across 13 or 14 stops, This represents 2 to the power 13 or 1 to 8000 dynamic range. The best film is, presently, matched by the best digital imaging.
The human eye has a much greater range, in total, but we all know that it takes time to sensitise to low light levels, to adjust to viewing the stars at night for example. At a moment in time, you eye in bright light may have a dynamic range of 1 to 1000. Give it time to adapt, and it has a total range of 1 to 1,000,000,000 or one to a billion. And we all know that in brighter light, we are very sensitive to colour. When we are looking at fainter objects, when we are looking at a street at night, we see more in black and white. The colour sensitive parts of our eye, the “cones”, do not function at low light levels, and similarly the low sensitivity dectors, the “rods”, detect little in bright light.
The eye, in fact, sees intensity logarithmically, which means that when we look at and order parts of a scene as having relative brightnesses of 1, 2 and 3, the actual light energy reaching our eye from these areas could vary as 1, 4 and 9.
And one reason why this reduced range for a jpg does not generally matter is that a photograph printed on paper has a dynamic range of barely 1 to 100, whilst one shown on a typical laptop screen may reach to 1 to 1000.
What that means, for looking at the petroglyphs of Huancani, is that photographs looked at later on my computer will show me more than I can see, looking at the stones in the intense sunshine of a sunny Peruvian coastal valley. And there is, in turn, more information in the digital image than I can see on the screen -though I can this also by adjusting brightness and contrast. It means that there are images on the stones that I will not see, if the sun is at the wrong angle. I saw a snaking line, some bird silhouettes, and a sitting shaman on the Stone of the Monkey, the first time I crossed the river. A year later I discovered the same stone had a dozen centred circles along its front face. The face in front of which I had been standing on my first visit.
The digital camera with which I take the images has a digital range of 16,000, a good deal more than my eye in strong sunshine, but all this is compressed by the jpg into 256 levels.
The response of digital sensors is essentially linear, but the response of film is not and and nor is that of the compressed jpg.
The compression aims to help my eye by showing more contrast in the lighter areas, where the eye is less sensitive. The camera makes a non-linear adjustment, to help my own non-linear eyesight.
The compression makes perfect sense if we are reproducing a digital image with a high dynamic range, a great difference in intensity from the brightest to the darkest areas, on a computer screen or a print, which can not reproduce the full range.
The non-linear adjustment similarly is understandable, if the eye is sensitive to colour only at the higher light intensities, and is furthermore limited in its differentiation between high intensities. The jpg storage typically stretches the contrast at the brighter end, and correspondingly reduces it at the darker end. It throws away information in the original image that the eye can not see.
Cameras typically adjust by a Gamma-factor, or against a Gamma-curve. This is a logarithmic adjustment, so that the jpg pixel value would be
Vout = (Vin) to power gamma
Where Vin is the Raw image pixel value, which is proportional to the light intensity, and the gamma value is typically 1/2.2.
In addition the compression will set the middle range of illumination around 25% brightness, so that on a 0-64,000 RAW scale, 16,000 would equate to 150, 24,000 perhaps to 200 and 28,000 to 220.
A range of 0 to 64,000 on a RAW image would translate to a 0 to 256 brightness range on a jpg image.
So, if I am attempting to relate the brightness of a drawing on the rock, to the intensity of the light reaching the camera, and so to the reflectance of the rock surface which might be linked to wear, varnish, surface abrasion or several other factors, I need to use a RAW, unmodified image, or the CCD sensor values.
My original data with a jpg brightness of 220 for the “1964” heart, 200 for the Inca tupus, and 160 for the four legged llama, putting in a time period of 450 years between the heart and the tupus, gave me a date of 1350 before present for the llama. That was assuming a straight line relationship. Note that as I am extrapolating back from two relatively recent calibration dates, this is very sensitive to errors. If I take the tupus as having a jpeg brightness of 205, just 2.5% difference, I get an estimated age for the llama of 4×450 =1800 years before the present (a decrease in jpg value of 15 represents 450 years aging: a decrease of 60 represents 1800 years aging).
At the moment I have no justification for assuming a linear relationship. I could alternatively imagine an exponential relationship, which several theoretical approaches would suggest, so that a decrease in brightness from 220 to 205 represents a fractional loss of 205/220 = 0.93. A decrease from 220 to 160 represents 160/220 = 0.73 = 0.93 to the power 4, approximately. The result is similar, though the exponential assumption gives a slightly older date.
[I = Io ^- kt, Io in jpg pixels, t in years, where k = 1/22.5 so I = Io when t =0, I = 200 = 220- 20 when t = 450, I = 160 = 220- 60 when t = 450 x 3]
If I correct the jpg brightness to a RAW value directly proportional to the light intensity received at the camera, and so to the reflectance of the surface, I get
| IMG 215 | JPG value | Linear Date | Exp
date |
Calculated RAW | Linear Date | Exp
date |
| Heart 1980 |
220 |
1980 CE | 1980 CE |
6640 |
1980 CE | 1980 CE |
| Tupus 1532 |
205 |
1532 CE | 1532 CE |
5973 |
1532 CE | 1532 CE |
| Llama |
160 |
180 CE | 60 BCE |
4303 |
400 BCE | 140 CE |
| More honestly | JPG value | Linear Date | Exp
date |
Calculated RAW | Linear Date | Exp
date k = 1/2500 |
| Heart 1980 |
210+/- 5 |
1980 CE | 1980 CE | 6190+/-3% | 1980 CE | 1980 CE |
| Tupus 1532 |
185 +/-1 |
1532 CE | 1532 CE | 5170+/-0.5% | 1532 CE | 1532 CE |
| Llama |
142+/-5 |
450-1030CE | 850-150 CE | 3771+/-3% | 780-1000 CE | 740 CE |
[I = Io e-kt, Io in jpg pixels, t in years, where k = 1/6400 so I = Io when t =0, I = 200 = 220- 20 when t = 450, I = 160 = 220- 60 when t = 1500]
Of course, I still have no understanding of the process which leads to the darkening of the images, so the proposal of a linear or exponential relationship is purely speculative. It is nevertheless interesting to note that the predicted dates vary little – because the timescale and the relative variations in intensity are relatively short.
More simply, I can just see the brightness of the drawings as an ordering in time, like strata. I imagine early geologists saw the impossibility of dating stone deposits, as we have no way of knowing of knowing how fast or slow the deposits are laid down.
In fact we can imagine that different types of rock – sedimentary, volcanic, are laid down at vastly different rates even in one place – which has not been one place in time, and not even, with continental drift, one place in space. And from place to place, across kilometres and continents, the type of rock, the mechanism of deposit, and the rate of deposit, vary greatly. It is enough to look at one rock face in one place, with its faults and folds, tilts and dips, even inversions, to give up the challenge.
And yet, over several hundred years, a consistent picture, and a system of dating, has emerged.
One of the features that made this possible was the discovery of fossils, remains of creatures that once lived in the environment, that changed, very slowly, by evolution over time. It was easy enough to see that a particular fossil type was found in a particular type of rock, such as seashells in limestone, and then to trace the evolution of the shell form from older to younger rocks, so that even an inversion or fold could be identified.
The fossils allowed a timescale connection between rocks at different sites, and each new site had its own strata and its contribution to the overall dating system that was being developed.
Archaeological dating by strata in a excavated trench might seem similarly dubious – we can surely not know the rate at which rubbish or sediment or dust is laid down at a particular site, still less assume that the rate of deposition is the same across distant sites, and not even that it is the same in different parts of the same ancient settlement.
But it turns out that we don´t need to know that. It is enough that often, with care, some parts of a site can be found where the strata are undisturbed, and the lower layers are therefore older than the upper. In addition, there are sometimes markers – often ceramics -which can be either dated separately or cross-related with other sites.
In just this way, Tello laid the foundation of the chronology of the Peruvian archaeological record within the space of a single trip along the coast.
So with all due provisos, and without claiming any certainty of the dates, but for the sake of following the story to see where it takes us, I can interpret the southern face of Pariacaca Rock as follows.
Two thousand years ago, a spiral was drawn high up in the middle of the main face, with a serpent next to it, perhaps. To the left, at a similar height, were added a human figure holding a staff in his right hand, facing towards the viewer, the other arm raised to touch his elongated skull, or his tall hat, or his elaborate hair. Around him are other geometrical figures, now faint, a cross, a series of squares. Several hundred years later four beasts, perhaps five, with four legs clearly drawn, with short tails, pointed ears and open mouths, were drawn above this figure. They are fluid, in motion, each one drawn differently.
And then, a thousand years ago, across the peak of the rock, a great tableau is drawn – two giant round figures, with no legs but a curving tails, reach up their arms with three-fingered hands to hold a chain of icicles that fringes the mountain. One wears a belt with snarling fox heads at either end. A third figure, more human, has legs and feet and two short arms, but four rays rise out from his head, and two great arms or streams that reach up to the top of the mountain. On the right, two finely drawn birds fly upwards. Each has a forked tail and two narrow outstretched wings, like swallows, one with a dark or light patch at the throat, and one with patches on both belly and head.
A hundred years later come three llamas drawn in the round but poorly defined, walking across the face of the mountain, carelessly drawn over older images. Two curious birds stand at the foot, with beaks uplifted to the sky, one holding an object in its talons.
Two men standing low down to the left, lift to their mouths giant pipes, longer than themselves, with rounded ends. Close by a conch shell, or perhaps a pututu, a conch trumpet, is drawn in cross section.
Just a hundred years before the incas invade the coast, a condor was added, flying high on the shoulder of the mountain.
Then two silver cloak pins, tupus, are drawn with the head downward, on top of the four legged beasts and the figure with the staff and the headdress. A third is added a few years later.
Shortly after tumis, square knives, one with an ornamental handle but mostly crudely drawn, are marked to one side of the main panel. Perhaps this marked the coming of the Inca, an aggressive invasion of the sacred space.
Three llamas marching in line – highly stylised line drawings these, linear – are added coming over the shoulder of the mountain from the left.
And then, in the last historic addition to the tableau, perhaps shortly before the arrival of the Spanish, a path is marked, a line of dots up the face of the mountain. Another lowland path circles the foot of the rock, the coast road. It has been drawn several times, once clearly in the black rock varnish, but also below in worn grey stone. It could be that the stone never developed the varnish because it was under ground level, or that the varnish was removed where the ground covered it. Just above the coast road stands a man holding aloft what could be a llama. Half way up the mountain, a cat or fox climbs up the trunk of a tree.
The path does not go to the peak of the mountain, but rather to a figure which could represent a rock shelter or a cave. In front of this stands another human figure, wielding a knife in one hand, and a llama in the other.
We have a record of one thousand years of the people here recording their concerns, their values, their culture. It is more than a book, it is a library, written on the stones of Huancani. Slowly decaying, not yet recorded, still less translated or passed on.
The rock then most probably remained unchanged, unmarked, as the local population was decimated by disease, enslaved, kidnapped, forcibly moved, after the invasion, and then abused, intimidated and exploited for nearly five hundred years. Until one day someone came and drew his giant heart half a metre wide and tall, and the date, 1964, bruising the surface of the stone and breaking the varnish, in the centre of the main face, writing over the original spiral and the snake. On the northern face of the rock, he wrote JMJR, and then walked south and carved JUAN in giant letters over barely discernible markings that could be over two thousand years old. Juan worked hard, for several hours or even days, to leave his mark. Someone scrawled LIZ more crudely on the northern face, and on the front, over our staff holding figure from 2000 years ago, the llama perhaps a hundred years later, and across finely drawn tupus from over five hundred years ago, three or four very roughly scratched characters are partially visible of what perhaps read DUMY.