
My first sight of the petroglyphs on the orchard terraces showed me images of varying brightness, and a simple measurement from photographs of the Mala rocks enables an estimate of the age of the fainter images. Photographs show variations of pixel intensity from a modern heart (213), to three shawl pins or tupus (198), to a faintly discernible four legged llama (161), all images being at similar heights on the flat, inclined plane of the southern face of the Paria Caca rock.
The heart is dated 1964. But it was not recorded in the drawings of Cuban adventurer Antonio Núñez Jiménez who was Ambassador Extraordinary for Cuba in Perú from 1972 to 1977 and who published his four volume book on Peruvian petroglyphs in 1986. It was photographed by Henry Tantalean and published in a paper in 2010. 1980 is perhaps a reasonable estimate of the age of the heart.
So we can date Juan’s heart to 1964?
Well actually, no.
Antonio Jimenez Nuñez shows neither the heart nor the other Juan, in his record of the designs on these three panels in his epic study of Peruvian petroglyphs, published in 1986. Yet on other occasions such as in Toros Muertos he made the point of photographing and commenting on the damage done to the stones in modern times.
It seems probable that Nuñez carried out his visits, taking photographs and making drawings of the art, during his time as Cuban Ambassador to Peru, from 1972 to 1978.
Perhaps Juan with his giant heart across the face of the rock and the date 1964, is recording his marriage or the year when he met his love. He could have drawn it eighteen years later, in 1982. But since we are looking to calibrate a timescale of hundreds or thousands of years, the difference between 1982, 35 years old, and 1964, 63 years old, is not crucial. We have two potential dates to fit to our calibration curve.
The shawls pins have been used in Peru for a thousand years, up to Inca times and the invasion of the Spanish, and beyond. But for the purposes of dating I can assume those images, or the brightest images on the rock, which might be the knives or tumis, date to around 1532, when the Spanish reached Lima, or shortly thereafter. They brought massive loss of life through infectious diseases, slavery and brutality, coupled with instability through war, and resettlement and movement of peoples to tighten the colonial control. It is unlikely that normal life could have continued for long thereafter in this river valley.
Using a simple assumption that the recorded brightness reduces with age in a linear fashion, we see then intensity drops by 15, or 7.5%, in 45o years. It drops by 52, or 25%, in an unknown period. The brightness decrease is 3.5 times as much, so the time could be 3.5 times the 450 years, or 1575 years before the present. The llama, or its wild predecessor the guanaco, by this estimate, was drawn around 500 CE.
Although the date is far earlier than that proposed by archaeologists who have visited the site, such as, Tantalean or Guffroy, it is not outrageous. Stylistically, these four legged creatures bear resemblance to rock paintings of the Sierra, which have been tentatively dated to 2000 – 5000 BP. That dating was based simply on an assumption that they depicted wild animals being hunted, and thus were drawn by hunter-gatherers before camelids began to be domesticated around 2000 BP.
Elsewhere at the Rio Mala site, llamas are drawn in lines and groups low down towards the ground or on imaginary mountain pathways suggested by folds or creases in the rock. They are often lead by a human figure, as if being herded or taken for sacrifice. These animals in lines are depicted in profile with two legs, very stylised, often drawn simply with thin, perpendicular lines. The four legged camelids are drawn high up on the rock, running free, individually, like wild animals.
We have no mechanism to justify the linear relationship of brightness to age, it is just the simplest assumption. Some wear processes of the stones might be expected to give an an exponential relationship between age and wear, which would put the llama figures as even older.
There are so many variables here we are not controlling. How can we expect any useful measurement from photos taken one day last year?
At the moment, we are just comparing image intensity, for images on the same rock, mostly on the same photograph. I am using a camera set for automatic exposure, and most of the image is the unmarked face of the rock. The camera adjusts so that the black rock is the darker end of the exposure and the brightest lines are at the whiter end.
It would be more questionable to make comparisons between different photographs. But all the photos were taken in a couple of hours, between 12 and 2, and it was a sunny day, not cloudy. So illumination would have changed a little, but not that much. And the main face of Piedra 11, The Twin- Peaked Mountain, and Piedra 6, The Rock of the Spiral, are essentially flat. They are even at very similar angles, about 45 degrees to the horizontal in a North South direction, and running EW across the face of the panels.
It would be interesting to see how robust this brightness measurement is, by comparing across photographs. The previous brightness measurements were made on image 215, but a second photograph was taken of the same panel of The Twin- Peaked Mountain a few minutes later.
We can measure the brightness on this image 219 and see if they give use comparable results. The brightness readings from the first image, are shown in brackets after the Average Reading.
C
|
Piedra 11 IMG-219 |
Reading 1 |
2 |
3 |
4 |
5 |
6 |
Ave +- |
|
Heart |
210 |
190 |
210 |
212 |
210 |
210 |
207+-4 (213) |
|
Dot track |
198 |
190 |
203 |
200 |
200 |
190 |
195+-5 (202) |
|
Tupus (not visible on this image) |
|
|
|
|
|
(198) |
|
|
Old Llama |
152 |
130 |
155 |
150 |
154 |
146 |
145+-10 (161) |
|
Left hand lobster |
180 |
175 |
185 |
185 |
177 |
181 |
180+-5 |
|
Condor |
198 |
190 |
180 |
|
|
|
190+-10 |
|
Ice fall RH |
185 |
180 |
170 |
170 |
170 |
176 |
175+-10 |
|
Spiral |
170 |
|
|
|
|
|
|
|
Swallow |
174 |
183 |
178 |
180 |
172 |
181 |
176+-6 |
|
|
|
|
|
|
|
|
|
We can see that there is a difference between the first and second photographs, with the absolute value of the brightness being less on the second. The first photograph was taken, looking at the rock at an angle of 30 degrees from the perpendicular to the face, whilst the second was towards 60 degrees from the perpendicular.
But the change is brightness is only about 5%. The old llama merits more measurements, since the difference is towards 10%. But the relative brightness between different images is similar, even from photographs taken from different angles. The method is robust and repeatable. So now lets see if on our linear assumption, they give interesting dates.
Jean Guffroy, who has proposed a scheme for dating petroglyphs in four groups from the whole of Peru from north to south, suggests that the petroglyphs here largely date to the late intermediate, 1000-1500 AD. Henry Tantalean proposed that they were mostly Inca, but he was particularly interested in the tupu images and the porro, the star-pointed stone or copper clubs. He must have missed the Huarochiri pilgrimage of Paria Caca Rock, the great mask of Piedra 10, the double headed serpent winding along the southern crest of Piedra 4. In fact he missed a great deal, stating that there were fourteen rocks then measuring the height and counting the panels on just seven.
On the brightness measure, the T-shaped tumis are amongst the most recent. Not only that, but in line with an idea of the Inca attempting to dominate or brand the valley with their buildings, the tumi and porros are drawn carelessly, almost aggressively, on many rocks and over previous designs.But they do not trespass on the most fully conceived artworks, the big panels. On Piedra 11 they are drawn to one side of the Pariacaca image, and multiple times on the northern face. They cover Piedra 12, but are barely evident on Piedras 1 and 4, at the northern, upstream end of the site, as if they came from the south in a night raid. They appear to show a combination of respect and abuse, like teenage boys. They want to dominate but at the same time they are perhaps afraid, of what might still be powerful religious forces.
What does stand out from the age estimates is the early date for the old llamas. We can make more measurements to check that – there are three llamas like than on the Rock of the lobster gods, a couple on the reverse, and four or more on the Rock of the Serpent. There is also at least one, finely drawn, on the Hidden Face. But it may not be right to assume that four legged camelids all have a similar date, and all pre-date the more stylised two legged images.
The dating of rock art in Peru has been largely done on largely stylistic grounds. The earliest is art of a characteristic style linked to the ceremonial centre of Chavin de Huantar high in the central andes. The puma iconography features claws, teeth, eyes and snarling mouths in a very distinctive style, not unlike some classic Picasso. Similar designs appear as stone carvings and adobe murals throughout much of Peru and are dated to a period from 3400 to 2300 before the present. This style is most confidently identified at petroglyph sites in Northern Peru. There is however at Huancor, just 50 kilometres from Cochineros over the mountains, one characteristic Chavin, Chavinoid or Cupisnique drawing, of a fanged face. A second apparent abstract design appears to include a tongue, teeth, and another important identifying feature, the hanging eye. Adobe murals found at Caral, in the Lurin valley north of Cochineros, show typically Chavin (or Chavinoid) incisor teeth.
In the following period, 2300 to 1400 BP, according to Guffroy, the most characteristic composition is “large, carved panels covered in small figures juxtaposed or linked by lines. These motifs, difficult to interpret, are mostly found at sites on the north and central coast”.
At the same sites, some categories of figures such as the representation of animals or heads or anthropozoomorphic figures and more frequently isolated or occupy the central part of the engraved side.
This tradition “also very frequently features abstract motifs and symbols – suns, crosses, cupules, wheels…” Later traditions in the South are dated to AD600 to 1532, or 1400 to 500 BP. It is easy enough to argue that the rocks at Mala include all of the above. Small figures linked by lines could describe the side images of the double headed serpent, there are plentiful animals, llamas, fish, foxes, pumas, birds and more, anthropomorphs of a dozen different forms, cupules on Piedra 6, and suns, crosses and wheels across the upper surface of Piedra 1, the Rock of the Llamas, and on the eastern face of Piedra 4.
Dating by proximity to other archaeological remains has also frequently been proposed, whether from ceramic fragments or stone tools found nearby, or settlements, hearths and burials. But their closeness in space does not necessarily indicate closeness in time. The Mala valley has thousands of years of settlement clearly visible today close to the stones. It is true that there is an Inca fortress (1500 AD) a few kilometres upriver from Cochineros, but there are also Wari burials (600-1200 AD) just 30 km away at Huaca Malena, where thousands of Wari textiles have been recovered, many of them discarded by tomb raiders after more profitable gold and silver. The Wari were using as their cemetery an older fortress or residential site, which had flourished long before and then fallen into disuse around 500 AD. And along the shore there are the signs of people from 2000 BC who ate seafood, grew crops, weaved in cotton and buried their dead wrapped in reed mats. Which of these sites in proximity could be used to date Chincheros?
It might be we can see signs of several of these inhabitants of the valley and the shore, and others too whose textiles, fortresses and burials have not been found but whose drawings on stone bear testimony to their existence and ideas.
The brightness measurements suggest that most of the images could be placed in the most recent period, but there are images scratched on the stones that are now returned to the same colour as the base rock. They are difficult to see except by viewing the sunlight reflecting off the rock face. Then they are revealed as coarser areas, cut through the smooth patina of the rock.
We have no theory or mechanism to explain how the brightness of the drawings might decrease with age. We could however find one. For example, we know the base rock is dark, almost black, and if we superimpose a white layer, the layer might be expected to erode with time. In fact in micro-erosion analysis, looking at the erosion of sharp edges towards rounded forms, which has been used to date petroglyphs at several sites in Italy, Russia, and Australia, a linear relationship between the age of erosion and the depth of wear is postulated. It would be easy to construct a model of reflectance based on this, which would give a linear relationship between intensity of light reflected at a particular angle, and erosion time or age of the rock drawings.
We know that the 1964 image is brighter than anything else. And we can see other brighter images superimposed on older, darker images.
Yes the link between brightness and age is self evident on some, but not all panels. But if we want to make it quantitative, it will help to understand the mechanism for the darkening process.
But lets look at the known physics for light reflectance, absorption, dispersion and diffusion. The interaction of photons, light, with particles is complex and depends on particle size and chemistry. Some simple examples that have been mathematically examined are droplets – such as clouds of water vapour – particles in suspension, like inks, and powdered crystals.
One model might be how fog and cloud reduce visibility. It could be similar to our tiny crystals created by the scratching process, hiding the dark rock behind. The light hitting the surface is partly reflected and partly absorbed. The remainder is transmitted, passes through the layer. In the case of fog particles, the proportion reflected, absorbed or transmitted is dependent on the size of the water droplets and also of course the density of the cloud.
As the cloud descends or the fog rolls in, we know the effect is not linear, we talk about the visibility decreasing, being able to see 20 metres or 10 metres or 5 metres. If visibility is down to 5 metres then we see exactly the same for 10 metres and 100 metres. This, for the engravings on the stones, would mean bright white for some period of erosion, before the brightness begins to fade. Only later then are we able to see some time-dependent change. In other words, if a thickness of 1 micron completely hides the base stone, then a thickness of five microns will offer a pure bright image, unchanged, until the first four microns have eroded.
Light scattering actually takes place through a variety of mechanisms, and which of those dominates depends on the size of the particles compared to the wavelength of light. Rayleigh scattering is when the particles are smaller than the wavelength, that is the case for molecules such as oxygen and nitrogen in the atmosphere. The effect is to scatter shorter wavelengths making the sun look yellow and the sky blue. When the sun is low down on the horizon, the particles close to the earth´s surface are bigger, scattering even more, and the sun is red. But this is not an important type of scatter for visible light scattering from rock crystals.
When the particles are of a similar size to the wavelength of light, Mie scattering is the most important process. Smog, industrial pollution and pollen are important here.
But for the rock crystals exposed by scratching the surface of diorite, we are most likely looking at non-selective scatter, which affects all wavelengths equally. The engravings on the stones are white. Fog and clouds, paper and white paint, are examples of this type of scatter. The particle size, the minute broken crystal facets exposed in the rock, are much larger than the wavelenght of light. Looking down a microscope at a sample of the rock, this is what I see, tiny crystals a millimetre or a tenth of a millimetre across.
The appearance of the surface shows several different crystal types, and if the rock is diorite then it contains some biotite, some plagioclase feldspar and pyroxene. These broken crystal faces will reflect, transmit, reflect again internally and eventually reflect back.
One of the models, for absorption, such as particles in ink, proposes that a certain percentage is absorbed in a fixed distance. Half the intensity is absorbed in five metres, half again in the next five metres, and so on. This constant reduction in intensity (Lamberts Law) results in an exponential relationship, where the transmitted light, for example, falls off rapidly – and in a non-linear way -with increasing distance. It is the effect you would see in looking a light passing through, for example, a glass of beer. This model is interesting as it is a general proposal for all absorbing particles, but for the case of rock crystals the scattering and diffuse reflection are more important.
If the fresh white image is being hidden by the growth of an absorbing layer, this would tell us how it might vary with time. If the layer grows at a constant rate then a thickness of say 500 years would reduced the brightness to 90% of its original. Another 500 years would reduce it to 90% of that, making 81% of the original. And so on the brightness of the image would be reduced in constant proportion as 90%, 81%, 73%, 66%, 59%, 53%. Initially this is not far off a linear decrease, but it slows down, which means for greater age the apparent loss of brightness is less.
This is an exponential relationship of the form
Brightness B = Boe-kx
We saw a decrease in brightness from heart to dot track of about 5%, whichever of the two photographs we used. This relates to an ageing of 450 or 500 years, and so we can easily see that a decrease in brightness of 30% would be approximately six times as long, or 3000 years, using the linear assumption. But if an absorbing layer is forming by Lambert’s Law the exponential relationship will give us seven times as long, 3150 to 3500 years. The old llama is 30% less bright than the heart, from the first photograph, and 25% less bright on the second image (2500-2800 BP).
Another model deals with diffuse reflectance, for light entering a thin layer where the light is scattered or absorbed. A beam of light hitting a crystal surface is both reflected and refracted. A quantity of such small crystals appears white and strongly reflecting, as we see from powdered salt or sugar, both of which are whiter than large crystals.
The behaviour depends on the size of the particles: if they are large compared to the wavelength of light, for powders randomly oriented, the results is diffuse reflection – whereby the light is “reflected” equally in all directions. The actual intensity depends on the angle of the incident light.
For a sufficiently large number of particles and layer thickness, the result is diffusely reflected radiation, and this would appear to be the case with the more recent drawings, that look fresh and bright even when observed at angles appproaching 90 degrees to the direction of sunlight. As they age, the brightness – or the reflectance – at high angle decreases.
Our surface of broken rock crystals is bright white seen from any angle, which tells us it is reflecting most of the light, in a diffuse, direction independent, manner. The unbroken surface of the rock, in contrast, is strongly absorbing, since it appears black or dark grey.
The Kubelka Munk theory provides a prediction of reflectance, for light entering a thin layer where the light is either scattered or absorbed. The theory was developed in the 1930s for paint films, and also has been applied to white papers. Unlike many approaches which are looking for spectral distribution, how the reflectance depends on wavelength, this is more general and assumes a diffuse light source and diffuse reflectance.
The Kubelka Munk theory applies to a Lambert´s Law ideal diffuse reflector, where the intensity of reflected, or more accurately re-radiated light, is angle independent. The white image, the drawing on the stone, behaves like this, a theoretical ideal which is also a good model for white paper, chalk on a blackboard, or matt white paint. And we can see that this is essentially the case, except under extreme conditions where, for example, bright sunlight is reflecting directly off the rock.
The intensity of reflected light for a Lambert material is dependent on the angle of the incident light, by a Cosine factor, so any quantitative measurements on the stones will have to be corrected for this if I am making comparisons, for example between different photographs at different times of day, or on stone panels at different angles to the sun or sky.
If I take a photograph of a rock face illuminated by the sun, the angle between the camera line and the sun varies, from the near side of the rock to the further side, and there will be a consequent baseline variation in reflected light, which can be easily seen and corrected for, by taking the ratio to the background of the dark stone at that point. For the largely flat surface of Piedra 6 or Piedra 11, it generates perhaps 5% variation, except when the sun is within a few weeks of solstice and shines over the shoulder of the rocks, generating unusual shadows.
Kubelka and Munk give us an equation that predicts reflectance based on two properties of the materials, absorbance coefficient K, the fraction of light absorbed by a thin layer, and the scattering co-efficient S, the fraction of light scattered backwards by a thin layer. They applied it successfully to papers and paints and it is the standard theory now used in industry for may such layers or coatings. If the white image is due to a coating of fractured crystals, on top of the darker rock, then this theory may help us understand what we see in the layered images of the stones.
The equation is an exponential, and is usually expressed in terms of quantities a, b, R’ as follows
Loge [{(R- a – b)/(R- a + b)}.{(R´ – a + b)/(R´- a – b)}] = 2bSX
a and b are derived from the scattering coefficient S and the absorption coefficient K as follows.
a= 1 +K/S and b = √a2-1
R is the reflectance, I/Io, the fraction of the illumination intensity reflected back from a thin layer, whilst R´ is the reflectance of the base layer.
For high absorbance and low scatter, such as dark particles suspended in liquid, a cloudy beer, this simplifies to the Lambert’s Law exponential decrease in transmittance. But we are dealing with mineral crystals, and absorbance is low but scatter high.
We actually want Reflectance in terms of X, so we are interested in this models prediction for how the brightness of an image drawn on the stone, would change as the thickness of the layer changes through erosion or wear.
We do not know K and S, but we can look at the data collected and the measurements made by people who work in the paints and paper industries, to see what might be realistic values to test the hypothesis.
For high reflectance materials K/S is low, from 0 to 1 or 2. But highly absorbing materials can have K/S=10 or 20. The latter values are attained by for example black paints and pigments. The marks on the stones are clearly bright and white, so we would expect a low K/S. Typical values for different paints in visible light give S varying from 0.1 to 0.2 for the lightest colours, with K at 0.01 or less.
For paints and papers, there is a relationship between the K/S ratio and the reflectance for a thick coating, sufficient to hide the layer beneath. If this reflectance is 80%, typical for a matt white bleached paper, K/S is o.o25.
The solution to the K-M equation can be written in several forms one of the simpler of which is

Here Rinf is the Reflectance of an infinitely thick layer which for a high opacity paint might be five coats, and for white paper ten sheets. Ry is the reflectance of the base layer, and if we imagine that all the light is absorbed, for white paint on a black surface, chalk on a blackboard, or petroglyphs on a matt black rock, we can set that to zero.
This will allow us to relate brightness of the image to thickness of the reflecting broken crystal, if we put in an estimate for the reflectance R for our feldspar-biotite-pyroxene broken rock surface.
Reflectance is an important property of the earth in determining the equilibrium temperature from solar radiation coming in and thermal radiation going out, and has been studied particularly intensely over the past 30 years as part of the assessments of man created global warming and climate change. For example, the US Geological Survey studied the properties of mineral particles collected from Colorado snow fields and found them to have a reflectance in the visible range of 15-20%, compared to global averages of 5% to 60%. The mineral components were largely quartz, clays and feldspar.
These were small airborne particles, dust, and the scattering and reflectance is strongly size dependent. In another study of terrestrial volcanic minerals designed to help interpret remote sensing data on planets and asteroids, small particles were found to have a reflectance of 0.2 to 0.5, whereas sections of mineral, rather than powders, had values of 0.1 to 0.2.
In lighting studies by architects and designers, they use data that puts the reflectance of white paint, plaster walls, ceiling panels and similar white surfaces at 80-85%. Light grey tiles would be 40% and dark grey would be 20%. Other sources have concrete down to 40% reflectance.
On balance, the intense whiteness of JUAN’s name on the rock is more white paper than grey tile, so I am going to use an estimate of 80%, or 0.8, for the thick layer reflectance Rinf.
If I put in these estimates in the Kubelka Munk solution I can plot the variation of brightness with the thickness of the layer of broken crystal. If the processes that erode the broken crystal, which might include oxidation, reaction with acidic or alkaline moisture from the atmosphere, or wind erosion, are assumed to be linear – reasonable if there have been no major climatic changes in the periods we are considering, of up to a few thousand years, then I will have a calibration curve between image brightness and age, which may justify my the linear approximation or refute it.
If I put in Rinf =0.8 and S=0.09 I can plot the relationship between the Reflectance of the image on the stone, and the thickness X of the coating.
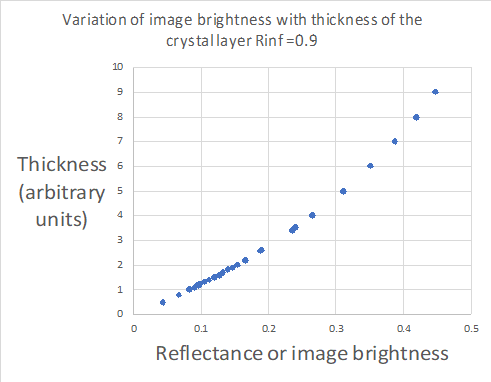
I can see that the graph above does indeed show a pretty strong linear relationship, which would support the proposed ages for the old llama. However the scale shows we are looking at reflectances up to 0.5 whereas our calibration points of Juan and the tumis are presumed to be a good deal higher, towards 0.8.
Lets look at the complete curve.
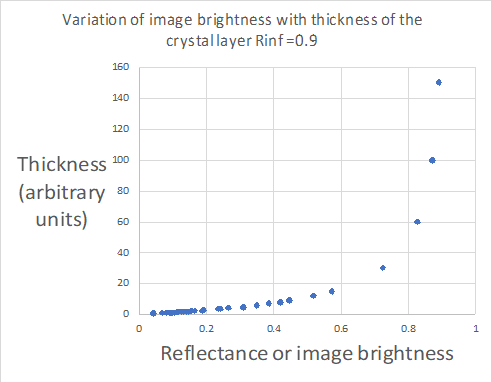
So as the layer gets thicker, just like adding more coats of paint, there is little further increase in reflectance. This means that our icons on the stone may change little in appearance for hundreds of years, and then fade rapidly. The image may fade from a brightness of 0.9 to 0.8 over 500 years, and then fade from 0.8 to 0.3 in the next five hundred years. Without more information we can not use this theory to calibrate our ages.
The Kubelka-Munk equation is an exponential relationship, which for certain ranges of values can give something close to linear. To use this to give a relationship between age and brightness we need to be much clearer about the actual values of K, S and R. We also want a better understanding of the microscopic process behind the fading of the images, to justify using this model.
Forward to 14 – Inca domination…
Back to 11 – How many llamas make a train…